R for applications in data science

R logo
The R logo, licensed under CC-BY-SA 4.0.

All posts with the R tag deal with applications of the statistical programming language R in the data science setting.

Posts about R

Determining the Distribution of Data Using Histograms

Determining the Distribution of Data Using Histograms

0

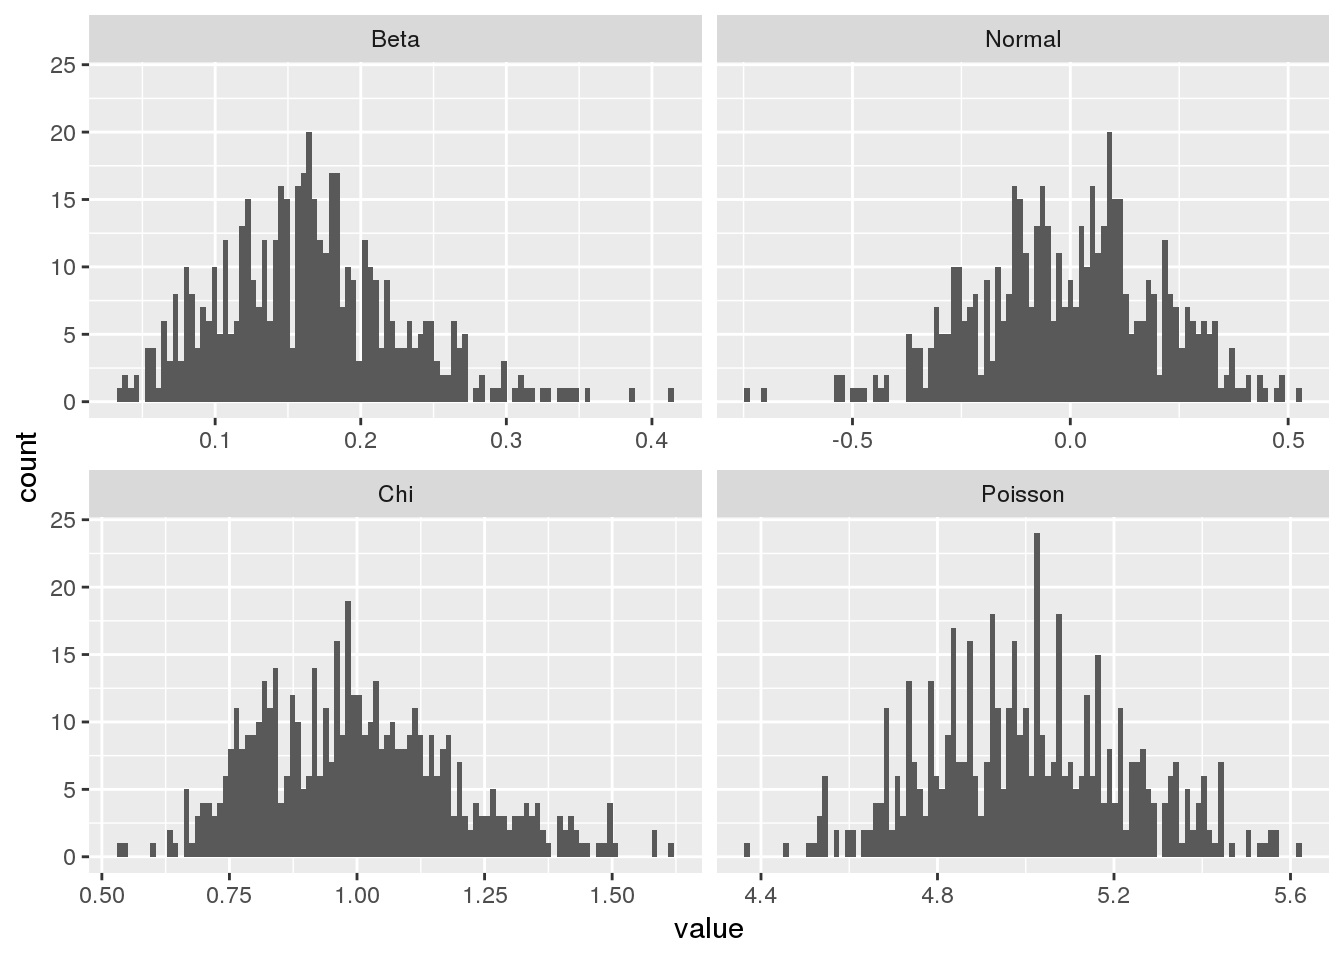
It is always useful to spend some time exploring a new data set before processing it further and analyzing it. One of the most convenient ways to get a feel for the data is plotting a histogram. The histogram is a tool for visualizing the frequency of measurements in terms of a bar plot. Here we’ll take a closer look at how the histogram can be used in R.

Mean vs Median: When to Use Which Measure?

Mean vs Median: When to Use Which Measure?

Two of the most commonly used statistical measures are the mean and the median. Both measures indicate the central value of a distribution, that is, the value at which one would expect the majority of data points to lie. In many applications, however, it is useful to think about which of the two measures is more appropriate given the data at hand. In this post, we’ll investigate the differences between both quantities and give recommendations when one should be preferred over the other.

Comparing Measurements Across Several Groups: ANOVA

Comparing Measurements Across Several Groups: ANOVA

The means of quantitative measurements from two groups can be compared using Student’s t-test. To compare the means of measurements for more than two levels of a categorical variable, one-way ANOVA has to be used. Here, we’ll explore the parametric, one-way ANOVA test as well as the non-parametric version of the test, the Kruskal-Wallis test, which compares median values.

Type 1 vs Type 2 Errors: Significance vs Power

Type 1 vs Type 2 Errors: Significance vs Power

When planning statistical tests, it is important to think about the consequenes of type 1 and type 2 errors. Typically, type 1 errors are considered to be the worse type of error. While the rate of type 1 errors is limited by the significance level, the rate of type 2 errors depends on the statistical power of the test. Here, we discuss how the null hypothesis should be chosen and how the two types of errors are related.

Effect Sizes: Why Significance Alone is Not Enough

Effect Sizes: Why Significance Alone is Not Enough

So, you performed a test for significance and obtained a positive result. That’s great but it’s not time to celebrate yet. You may ask: Why? Isn’t a significant test result sufficient to show the existence of an effect? This statement, however, is not true for two reasons. First, a significant result only indicates the existence of an effect but doesn’t prove it. For example, at a significance level of 5%, an exact test will yield a false positive result in 5% of the cases. Second, a significant result does not necessarily make a statement about the magnitude of the effect. In this post, we’ll investigate the difference between statistical significance and the effect size, which describes the magnitude of an effect.

Testing Symmetry on Contingency Tables from Paired Measurements: McNemar's Test

McNemar’s test is a non-parametric test for contingency tables that arise from paired measurements. In contrast to the chi-squared test, which is a test for independence, McNemar’s test is a test for symmetry (also called marginal homogeneity). Still, McNemar’s test is related to the chi-squared test because its test static also follows a chi-squared distribution.

Parametric Testing: How Many Samples Do I Need?

Parametric Testing: How Many Samples Do I Need?

Parametric tests are subject to assumptions about the properties of the data. For example, Student’s t-test is a well-known parametric test that assumes that sample means have a normal distribution. Due to the central limit theorem, the test can be also applied to measurements that are not normally distributed if the sample size is sufficient. Here, we will investigate the approximate number of samples that are necessary for the t-test to be valid.

Wilcoxon Signed Rank Test vs Paired Student's t-test

Wilcoxon Signed Rank Test vs Paired Student's t-test

In this post, we will explore tests for comparing two groups of dependent (i.e. paired) quantitative data: the Wilcoxon signed rank test and the paired Student’s t-test. The critical difference between these tests is that the test from Wilcoxon is a non-parametric test, while the t-test is a parametric test. In the following, we will explore the ramifications of this difference.