Although all posts in this blog are somehow concerned with analyzing data, not all of them lead to new insights. Posts in the analysis series exhibit at least one of the following two properties:
The analysis of the data is comprehensive (i.e. involving multiple approaches)
The analysis leads to new insights
Posts in the analysis series
The following posts are concerned with the analysis of individual data sets.
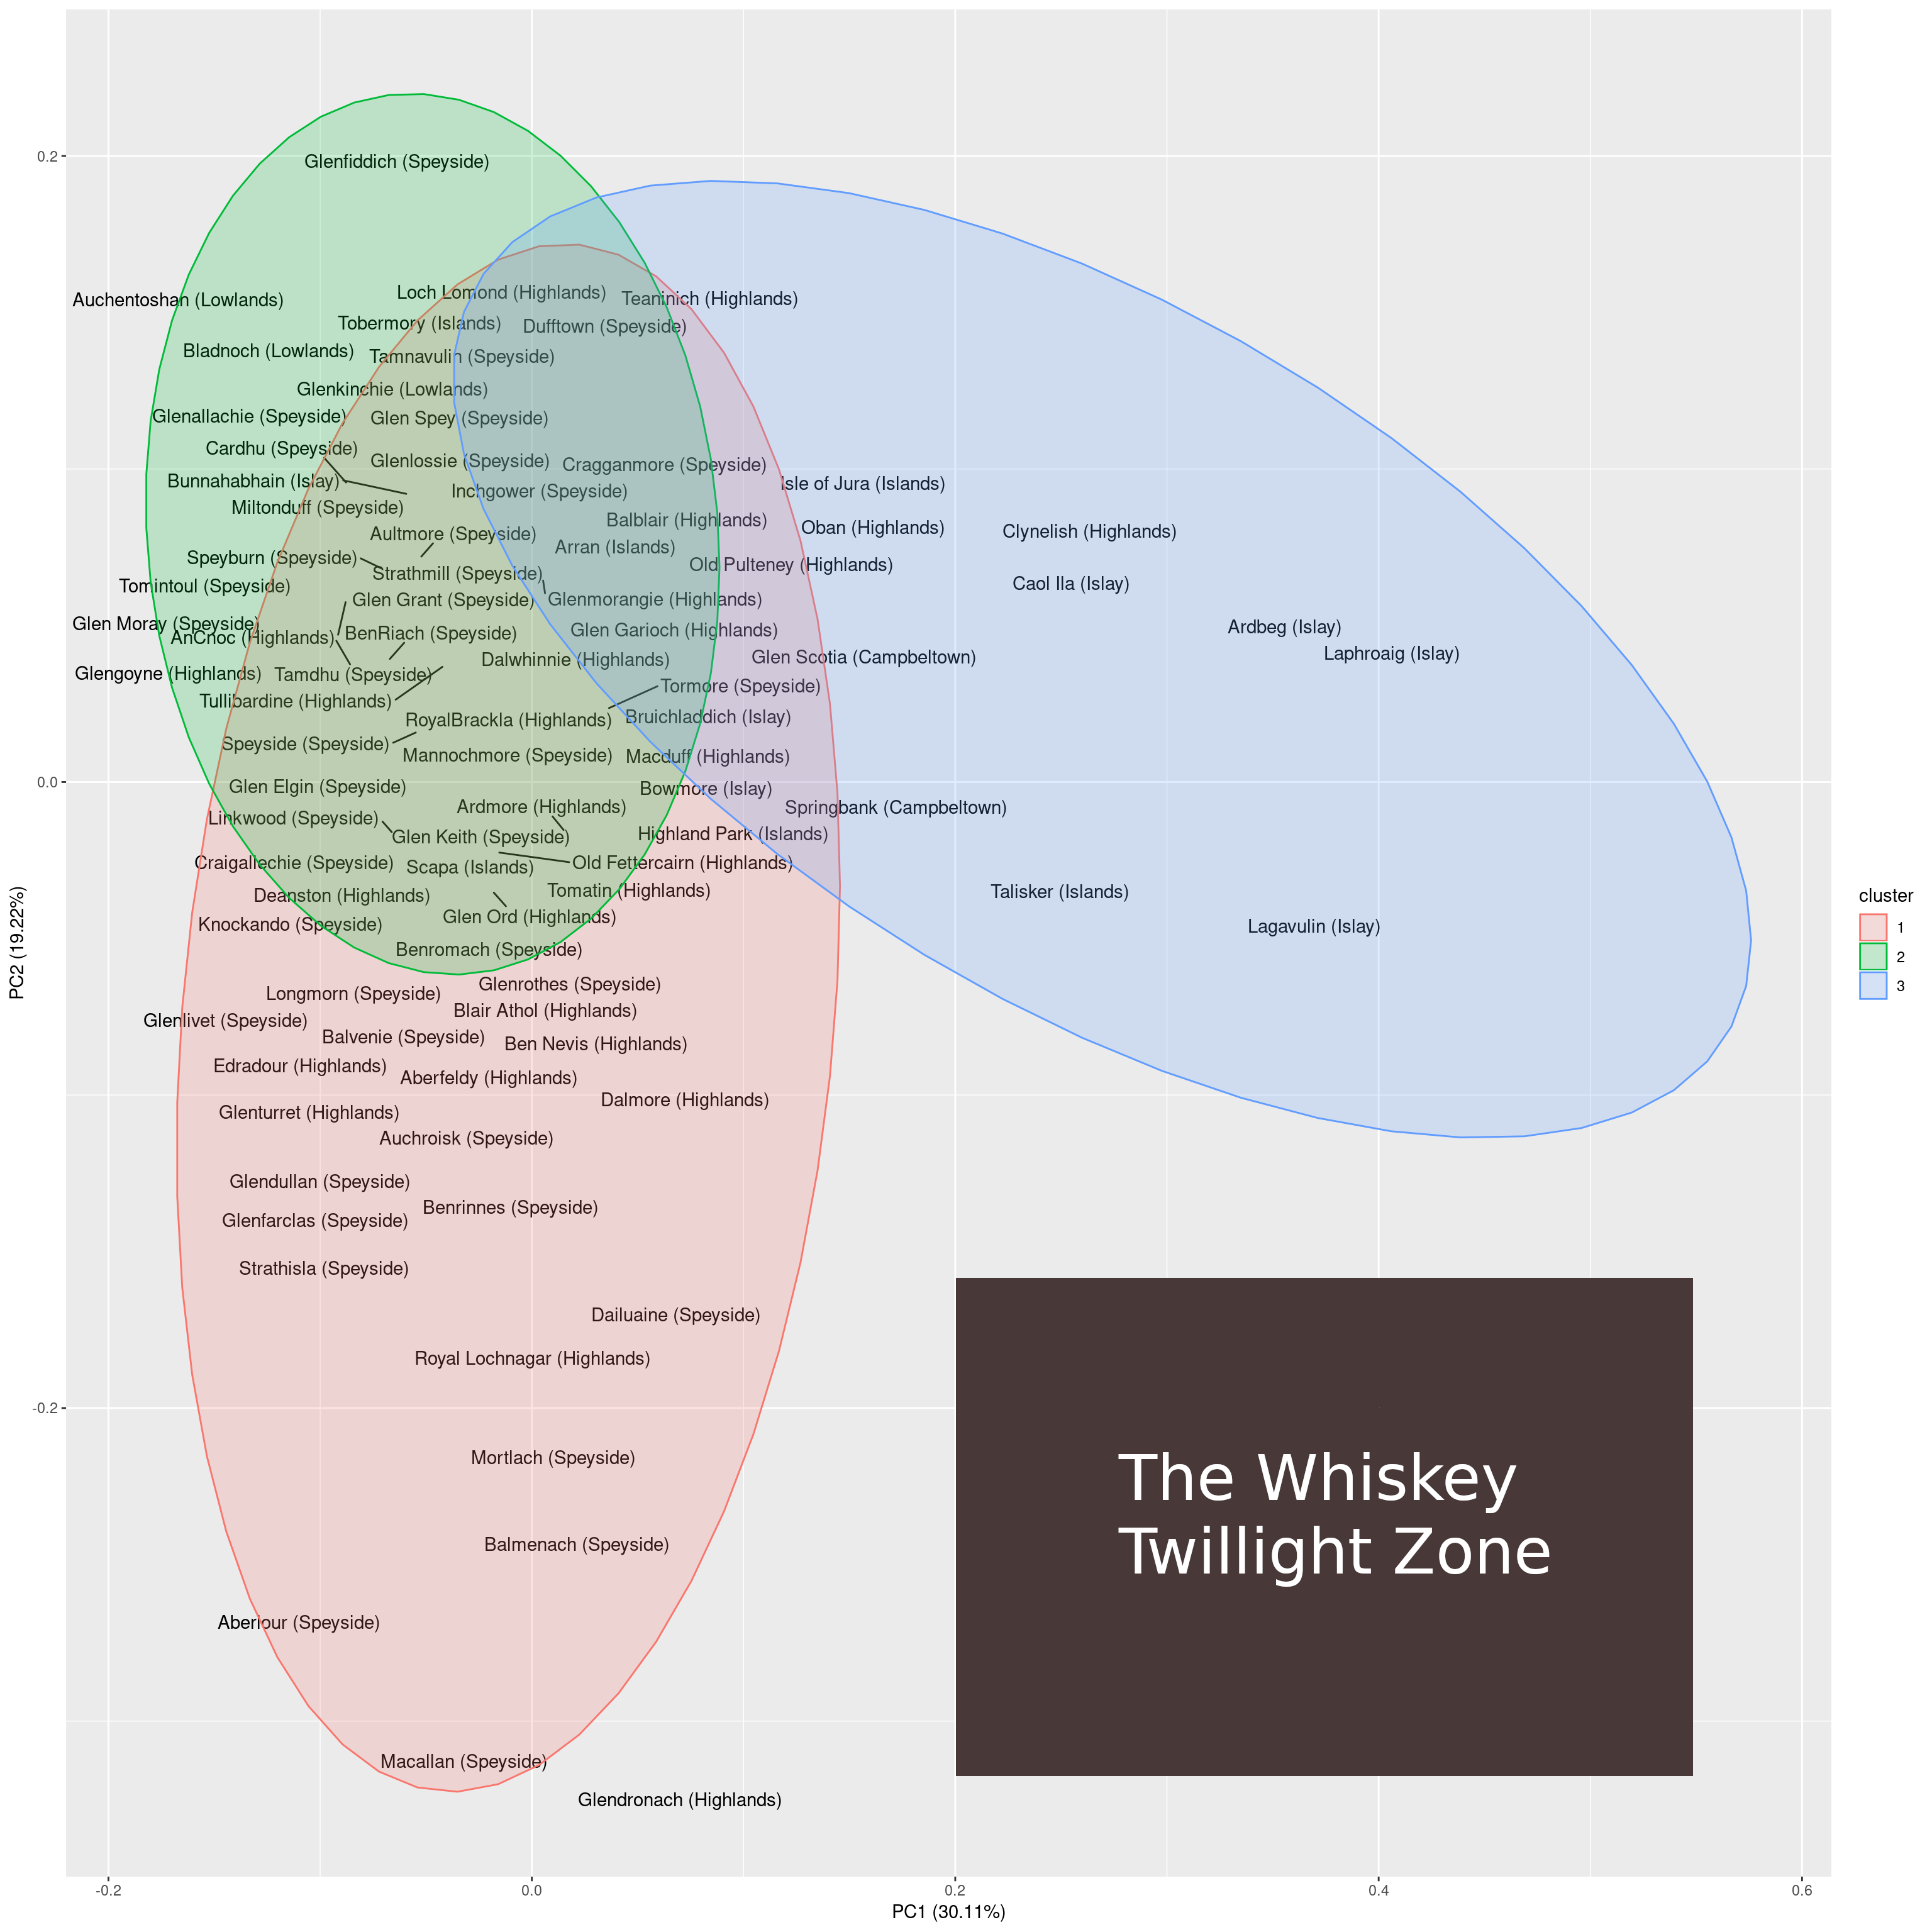
Dimensionality reduction has two primary use cases: data exploration and machine learning. It is useful for data exploration because dimensionality reduction to few dimensions (e.g. 2 or 3 dimensions) allows for visualizing the samples. Such a visualization can then be used to obtain insights from the data (e.g. detect clusters and identify outliers). For machine learning, dimensionality reduction is useful because oftentimes models generalize better when fewer features are used during the fitting process.
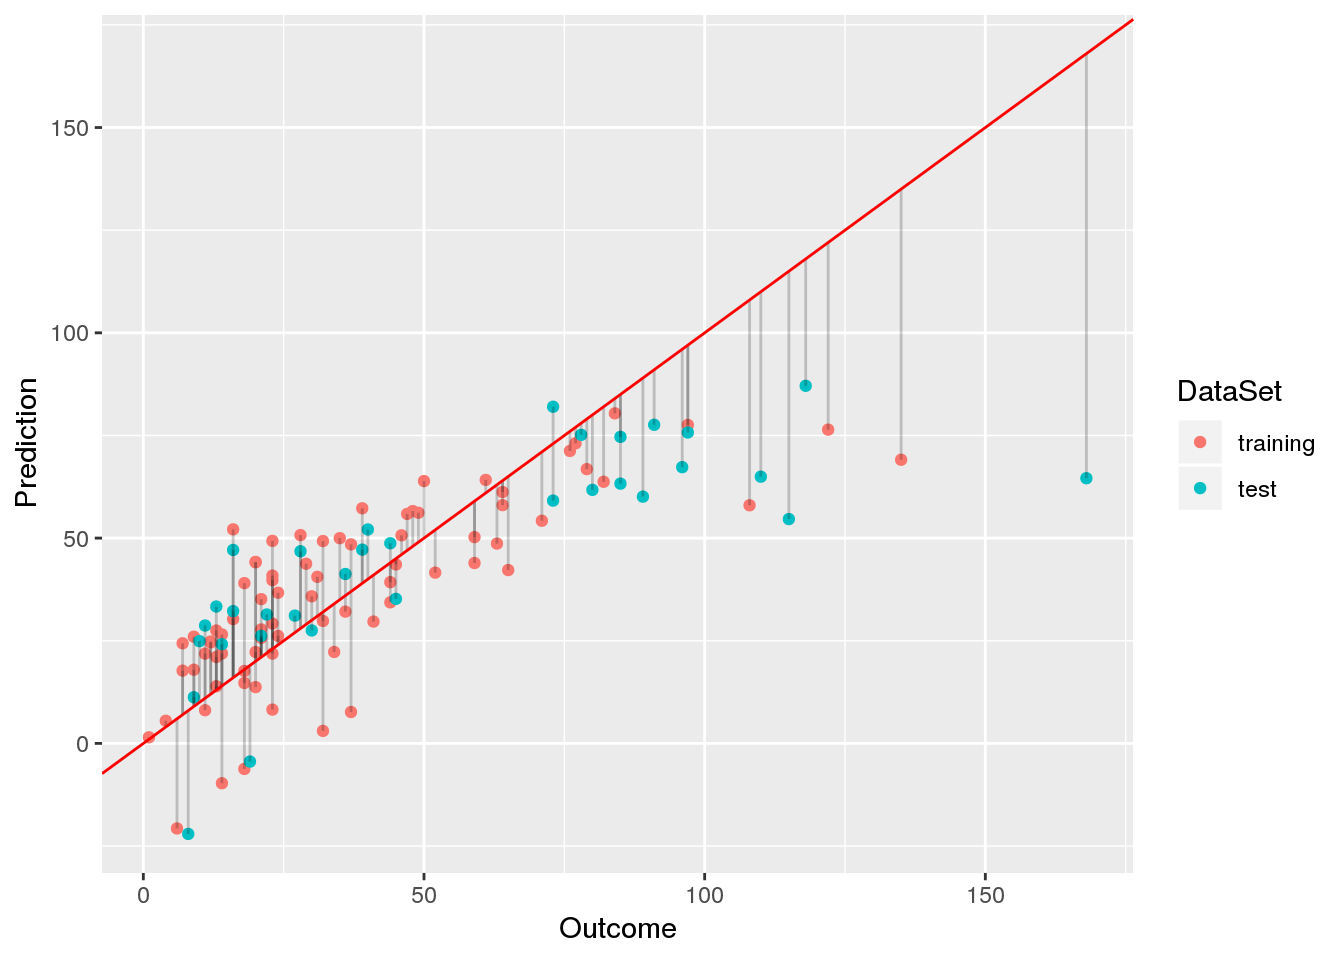
In a previous post, I have introduced the airquality data set in order to demonstrate how linear models are interpreted. In this post, I will start with a basic linear model and, from there, try to find a linear model with a better fit.
Data preprocessing Since the airquality data set contains some missing values, we will remove those before we begin to fit models and select 70% of the samples for training and use the remainder for testing: