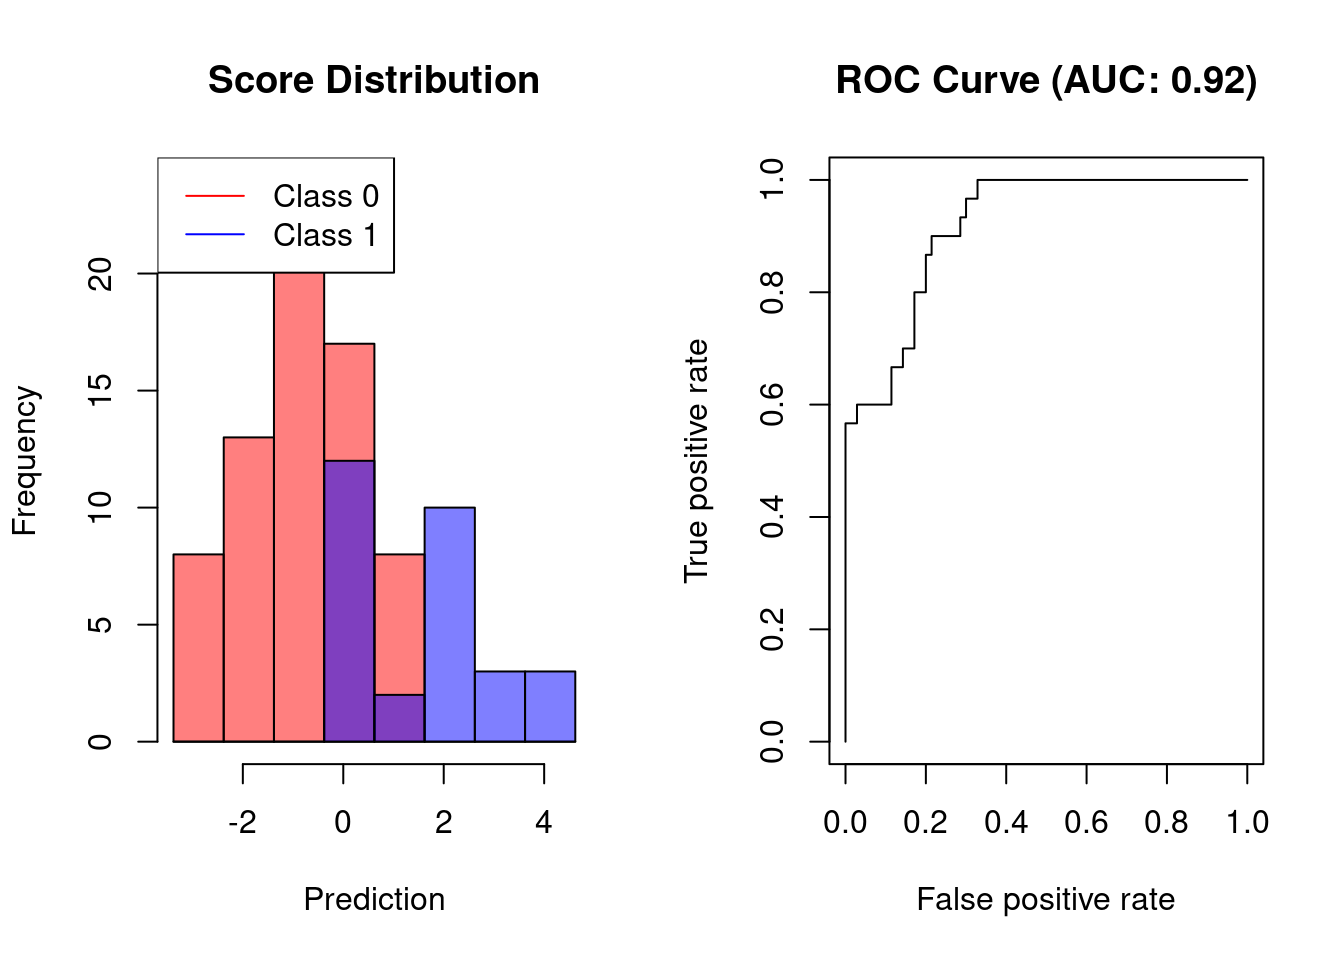
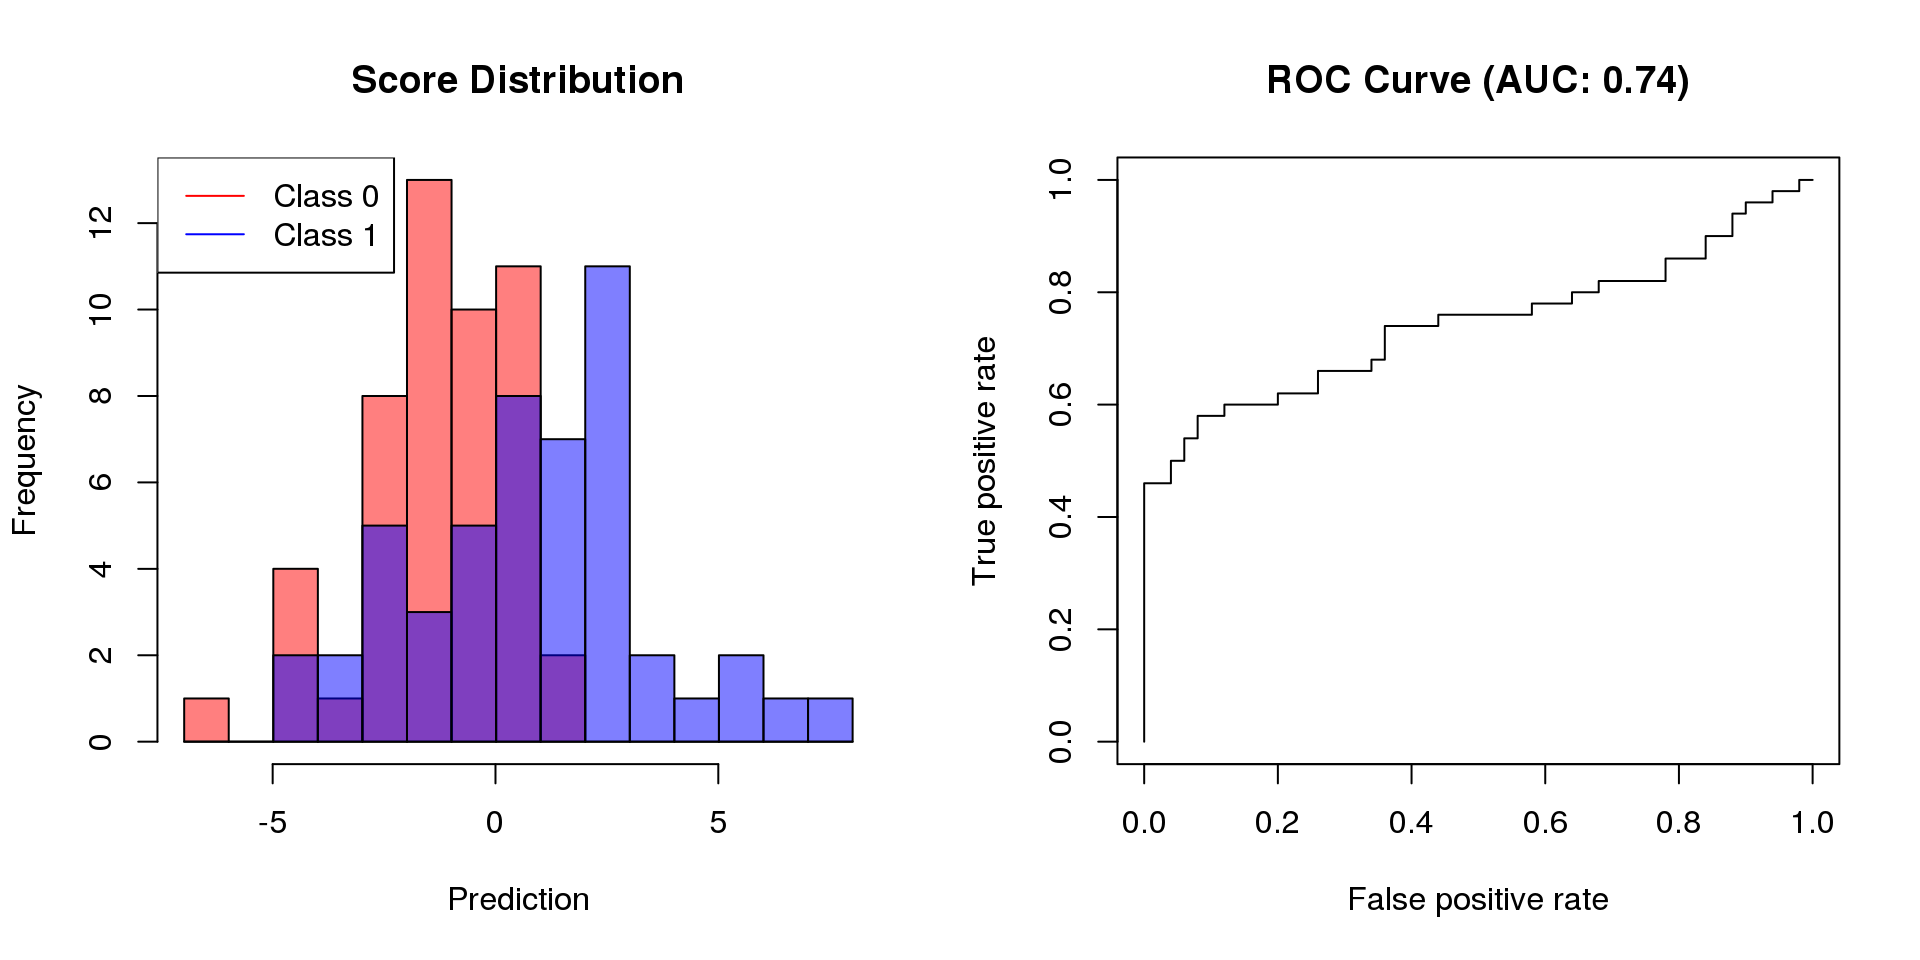
Receiver operating characteristic (ROC) curves are probably the most commonly used measure for evaluating the predictive performance of scoring classifiers.
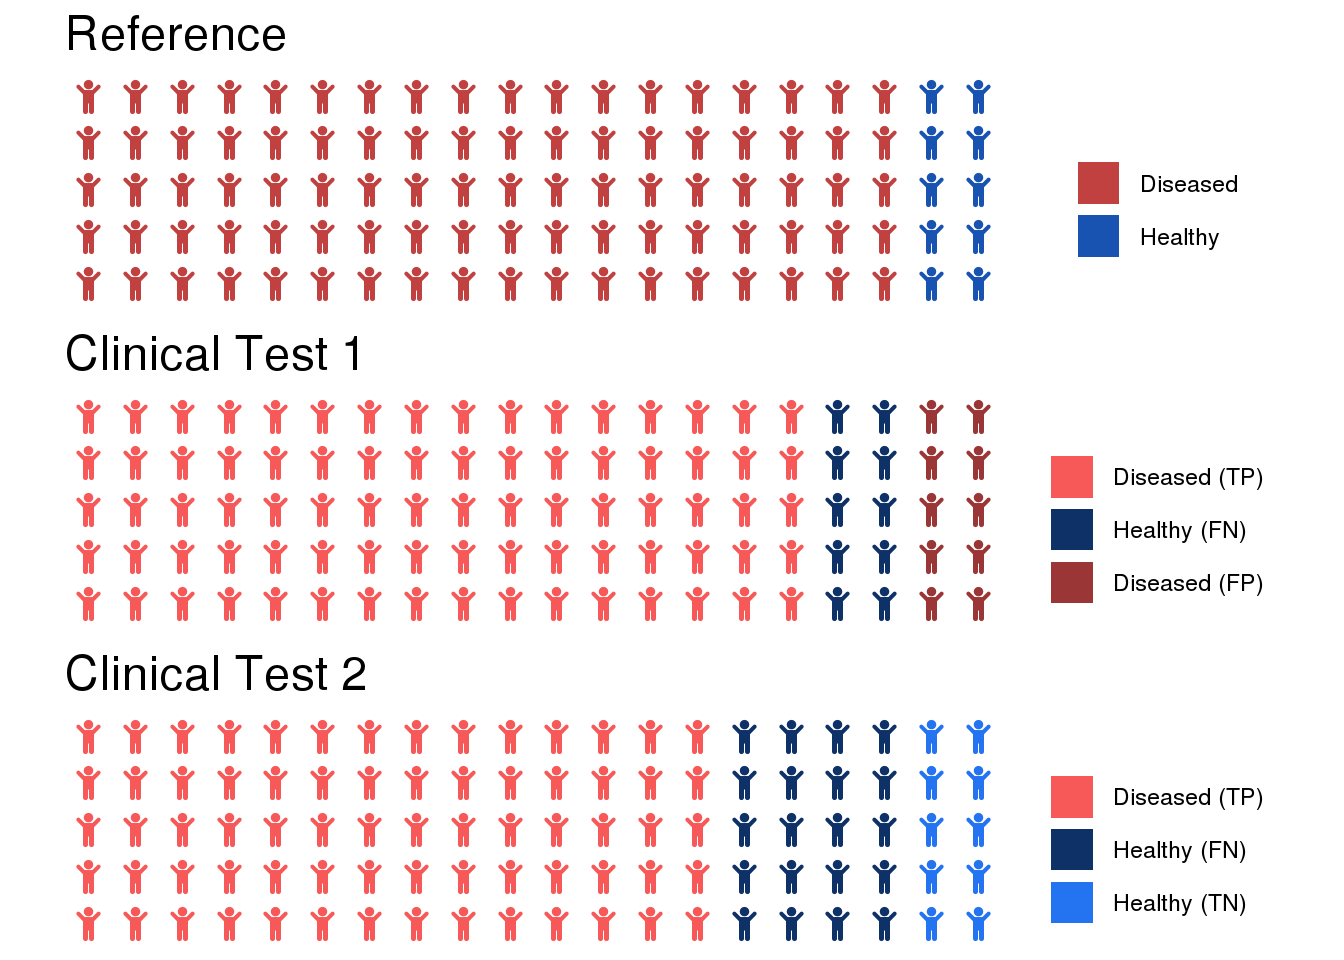
The confusion matrix of a classifier that predicts a positive class (+1) and a negative class (-1) has the following structure:
Prediction/Reference Class +1 -1 +1 TP FP -1 FN TN Here, TP indicates the number of true positives (model predicts positive class correctly), FP indicates the number of false positives (model incorrectly predicts positive class), FN indicates the number of false negatives (model incorrectly predicts negative class), and TN indicates the number of true negatives (model correctly predicts negative class).
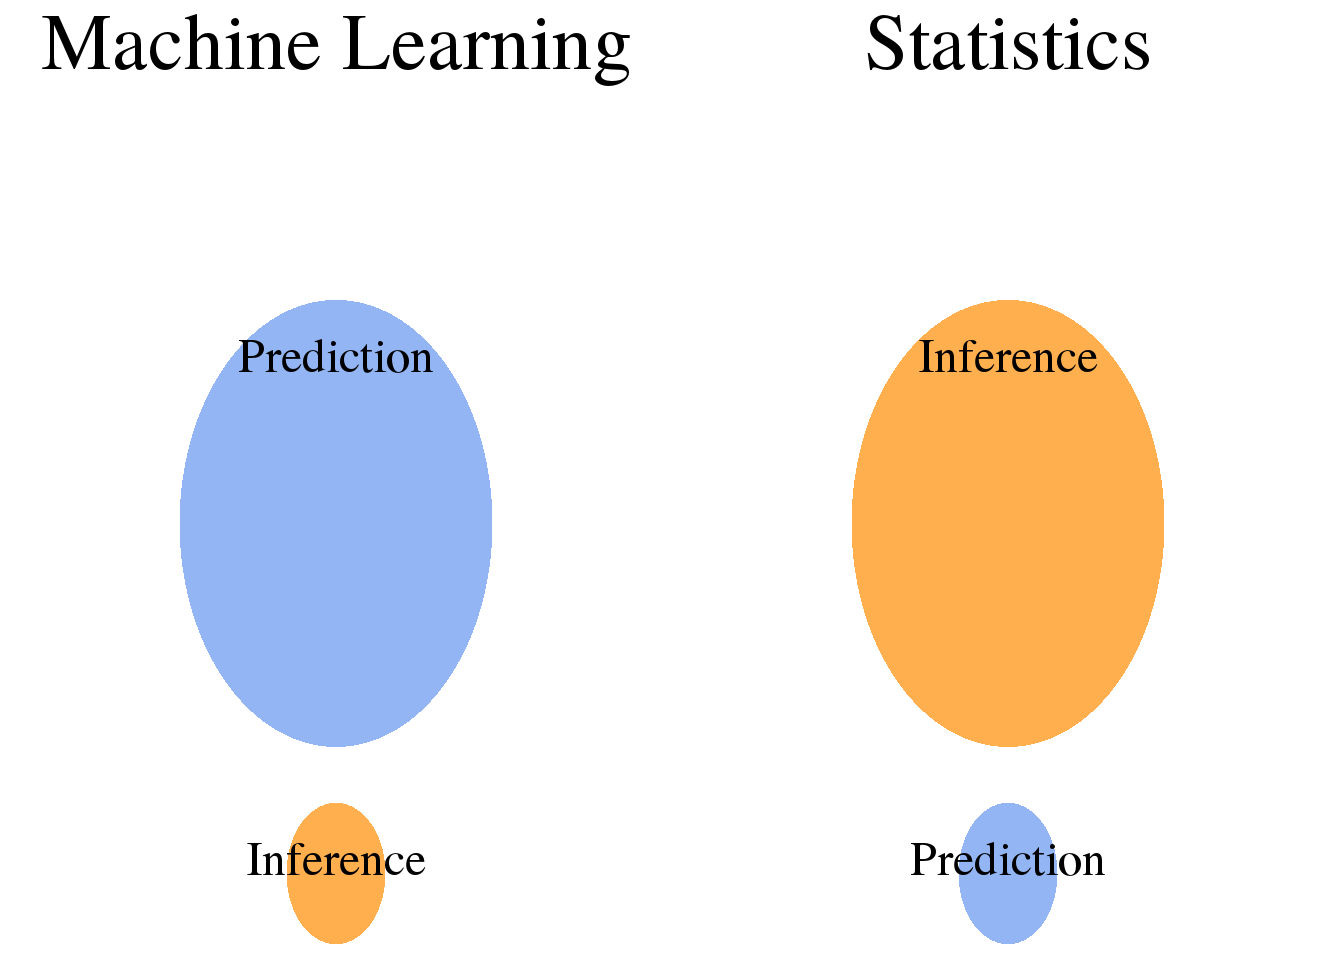
The terms inference and prediction both describe tasks where we learn from data in a supervised manner in order to find a model that describes the relationship between the independent variables and the outcome. Inference and prediction, however, diverge when it comes to the use of the resulting model:
Inference: Use the model to learn about the data generation process. Prediction: Use the model to predict the outcomes for new data points.
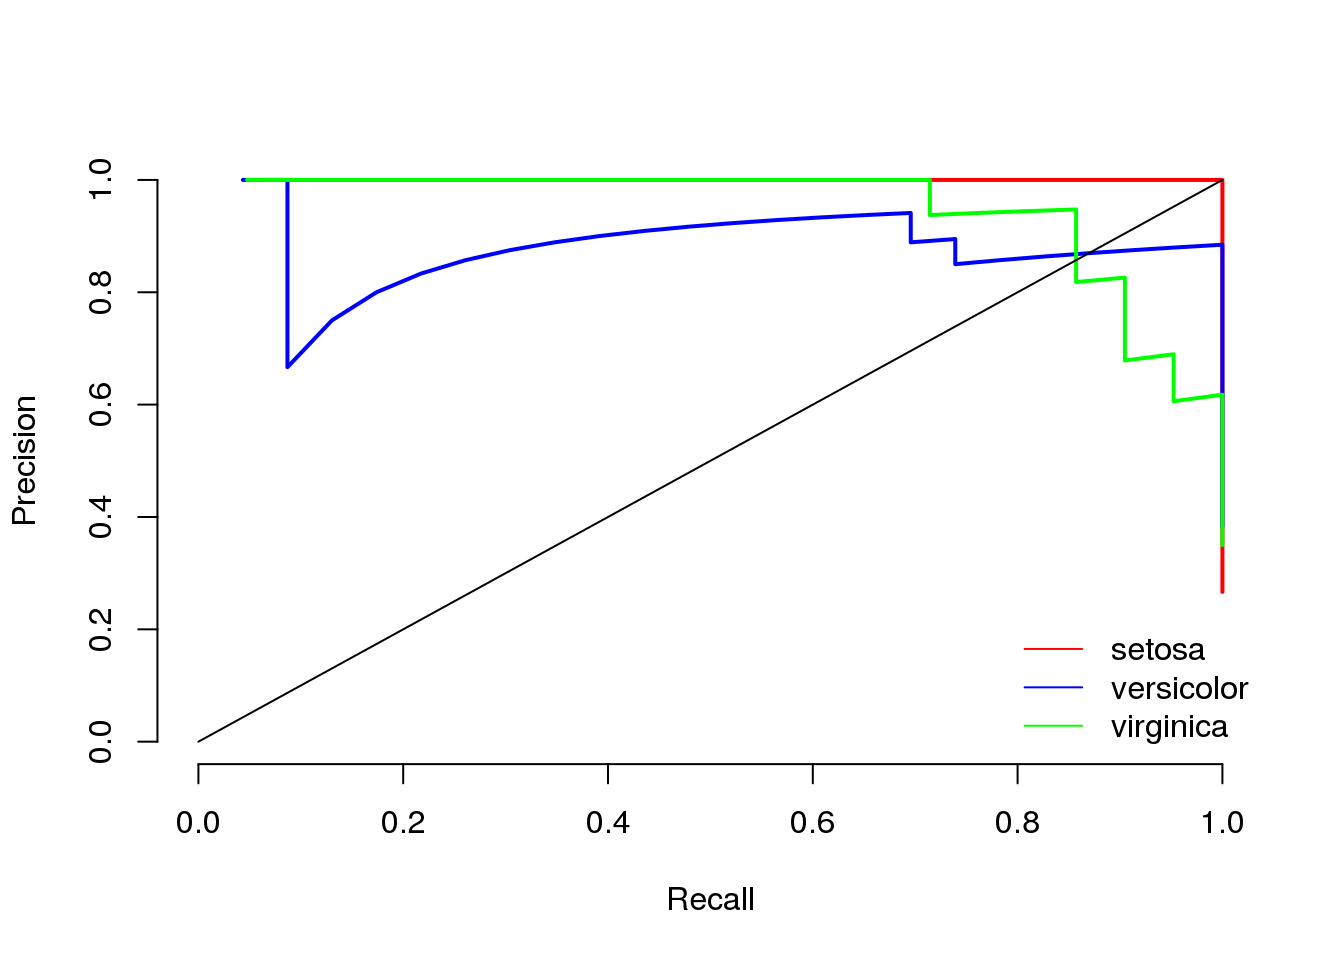
For classification problems, classifier performance is typically defined according to the confusion matrix associated with the classifier. Based on the entries of the matrix, it is possible to compute sensitivity (recall), specificity, and precision. For a single cutoff, these quantities lead to balanced accuracy (sensitivity and specificity) or to the F1-score (recall and precision). For evaluate a scoring classifier at multiple cutoffs, these quantities can be used to determine the area under the ROC curve (AUC) or the area under the precision-recall curve (AUCPR).
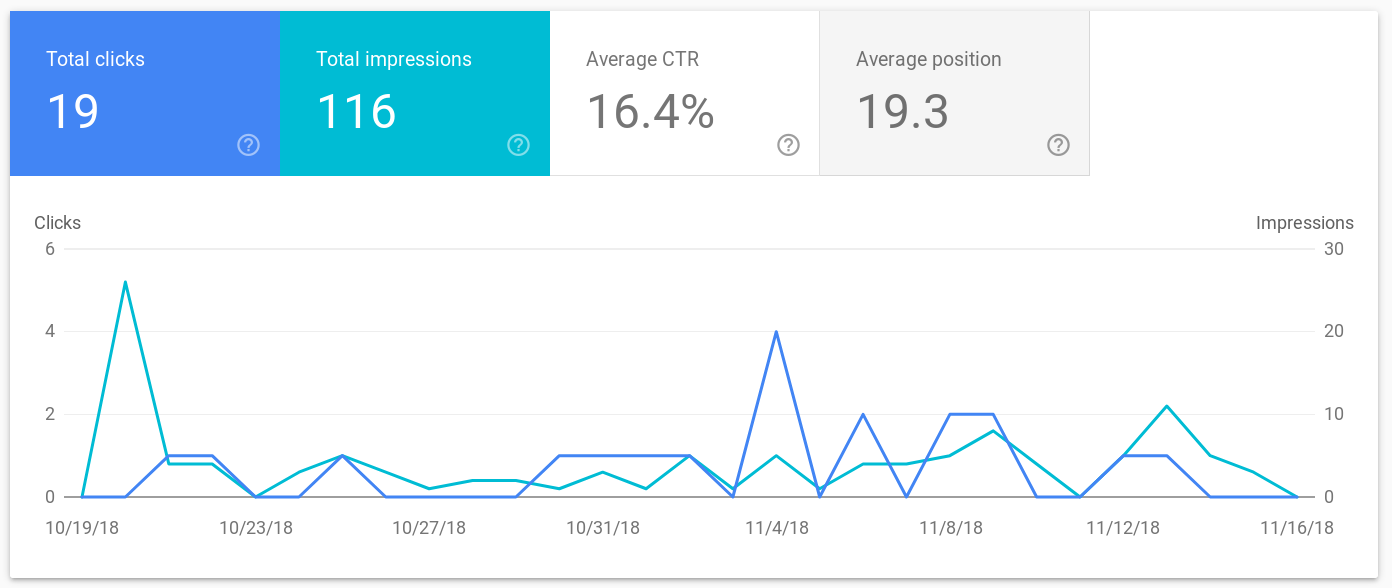
By now, datascienceblog.net already exists for one month, with the first post dating back to the 16th of October, 2018. I would like to use this opportunity to reflect on how the blog has developed since its inception.
Content I am quite happy with the amount of content I could produce over the last couple of weeks. Especially when starting a blog, high-quality content is the most important criterion for developing a user base.
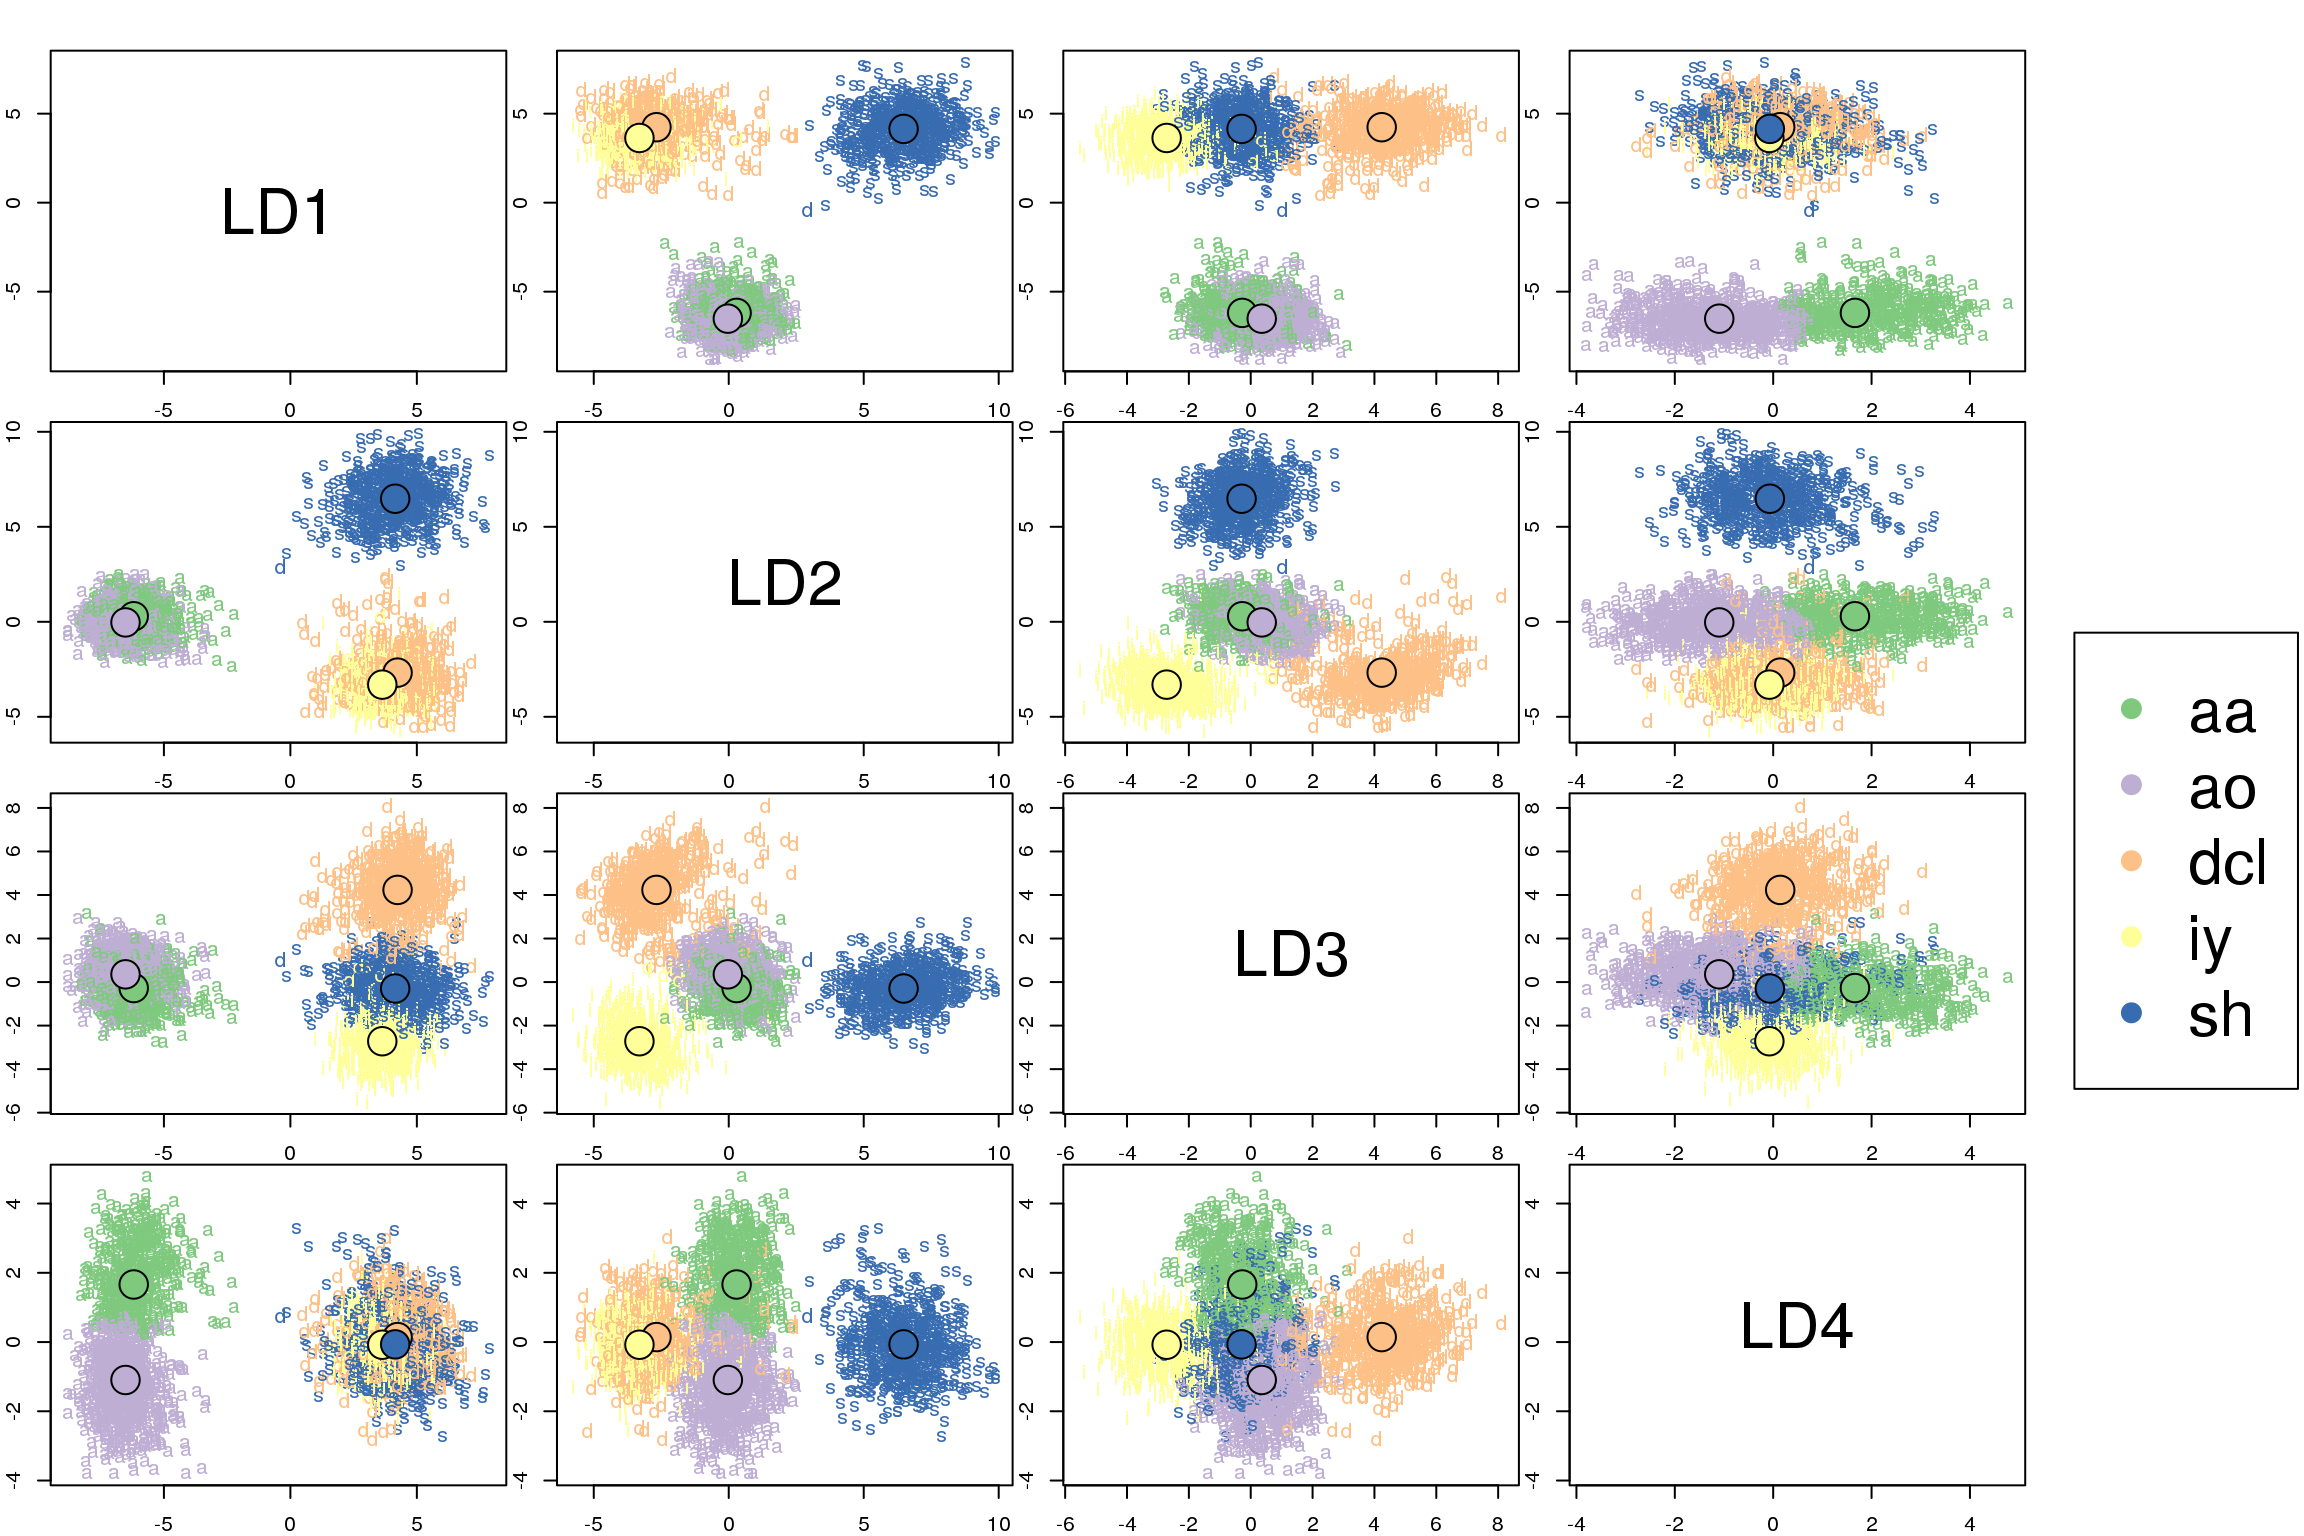
Discriminant analysis encompasses methods that can be used for both classification and dimensionality reduction. Linear discriminant analysis (LDA) is particularly popular because it is both a classifier and a dimensionality reduction technique. Quadratic discriminant analysis (QDA) is a variant of LDA that allows for non-linear separation of data. Finally, regularized discriminant analysis (RDA) is a compromise between LDA and QDA.
This post focuses mostly on LDA and explores its use as a classification and visualization technique, both in theory and in practice.
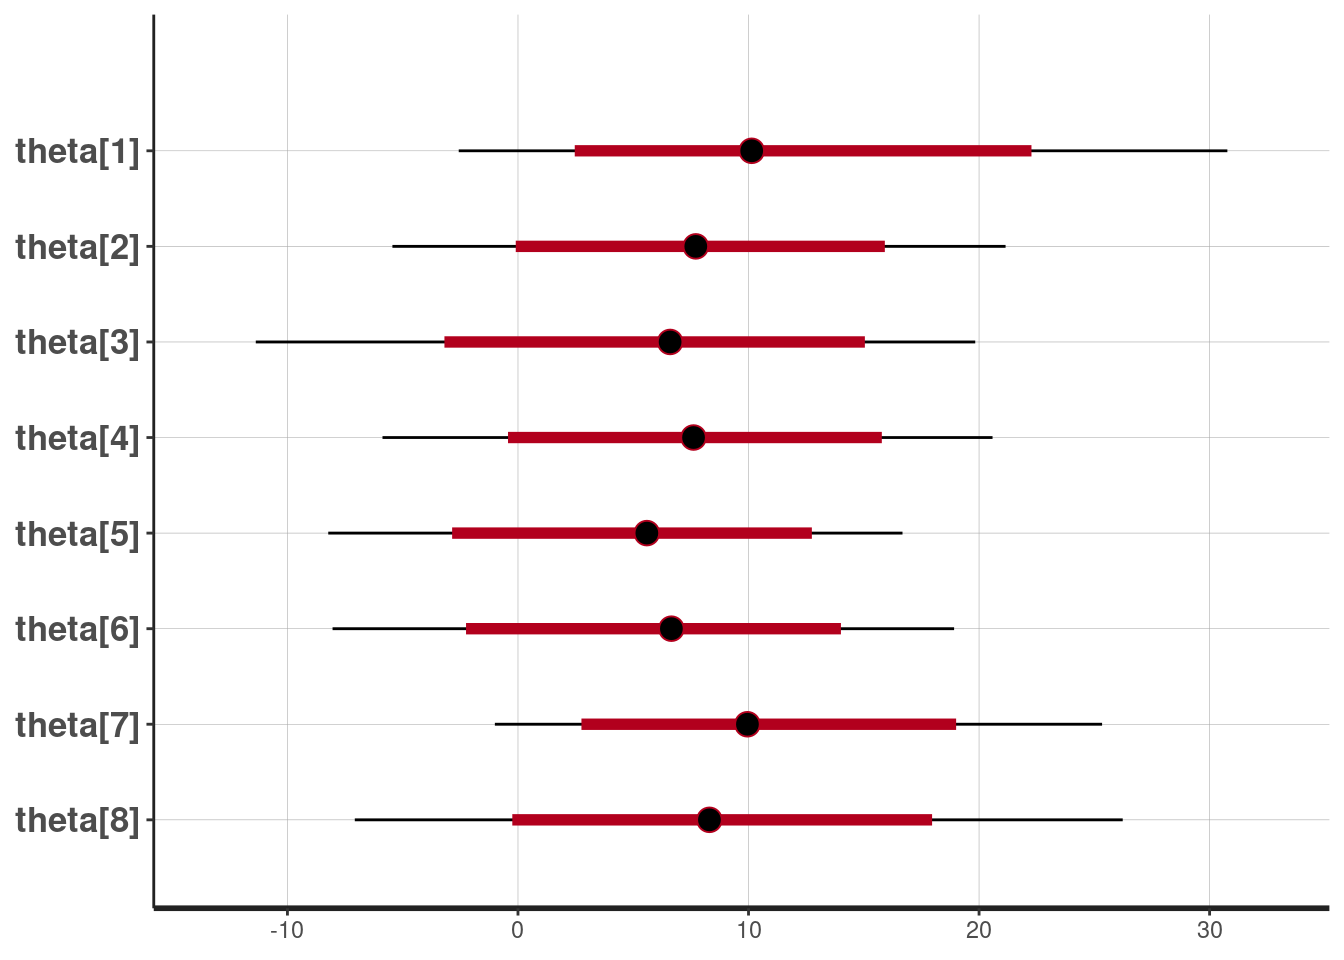
Probabilistic programming enables us to implement statistical models without having to worry about the technical details. It is particularly useful for Bayesian models that are based on MCMC sampling. In this article, I investigate how Stan can be used through its implementation in R, RStan. This post is largely based on the GitHub documentation of Rstan and its vignette.
Introduction to Stan Stan is a C++ library for Bayesian inference.
In a recent post, I have discussed performance measures for model selection. This time, I write about a related topic: performance measures that are suitable for selecting models when performing feature selection. Since feature selection is concerned with reducing the number of dependent variables, suitable performance measures evaluate the trade-off between the number of features, \(p\), and the fit of the model.
Performance measures for regression Mean squared error (MSE) and \(R^2\) are unsuited for comparing models during feature selection.
Recently, I have introduced sensitivity and specificity as performance measures for model selection. Besides these measures, there is also the notion of recall and precision. Precision and recall originate from information retrieval but are also used in machine learning settings. However, the use of precision and recall can be problematic in some situations. In this post, I discuss the shortcomings of recall and precision and show why sensitivity and specificity are generally more useful.
There are several performance measures for describing the quality of a machine learning model. However, the question is, which is the right measure for which problem? Here, I discuss the most important performance measures for selecting regression and classification models. Note that the performance measures introduced here should not be used for feature selection as they do not take model complexity into account.
Performance measures for regression For models that are based on the same set of features, RMSE and \(R^2\) are typically used for model selection.
Variables can be differentiated by two characteristics. The first characteristic is the scale of the variable (i.e. the values that the variable can assume). The second is the role that the variable fulfills in a statistical model.
Measurements scales of variables Variables can be on the following scales:
Quantitative variables: Variables indicating numeric values for which pairwise differences are meaningful. Categorical variables: Variables representing a discrete set of groups.