Machine learning is a field of artificial intelligence (AI) that is concerned with learning from data. Machine learning has three components:
Supervised learning: Fitting predictive models using data for which outcomes are available.
Unsupervised learning: Transforming and partitioning data where outcomes are not available.
Reinforcement learning: on-line learning in environments where not all events are observable. Reinforcement learning is frequently applied in robotics.
Posts on machine learning
In the following posts, machine learning is applied to solve problems using R.
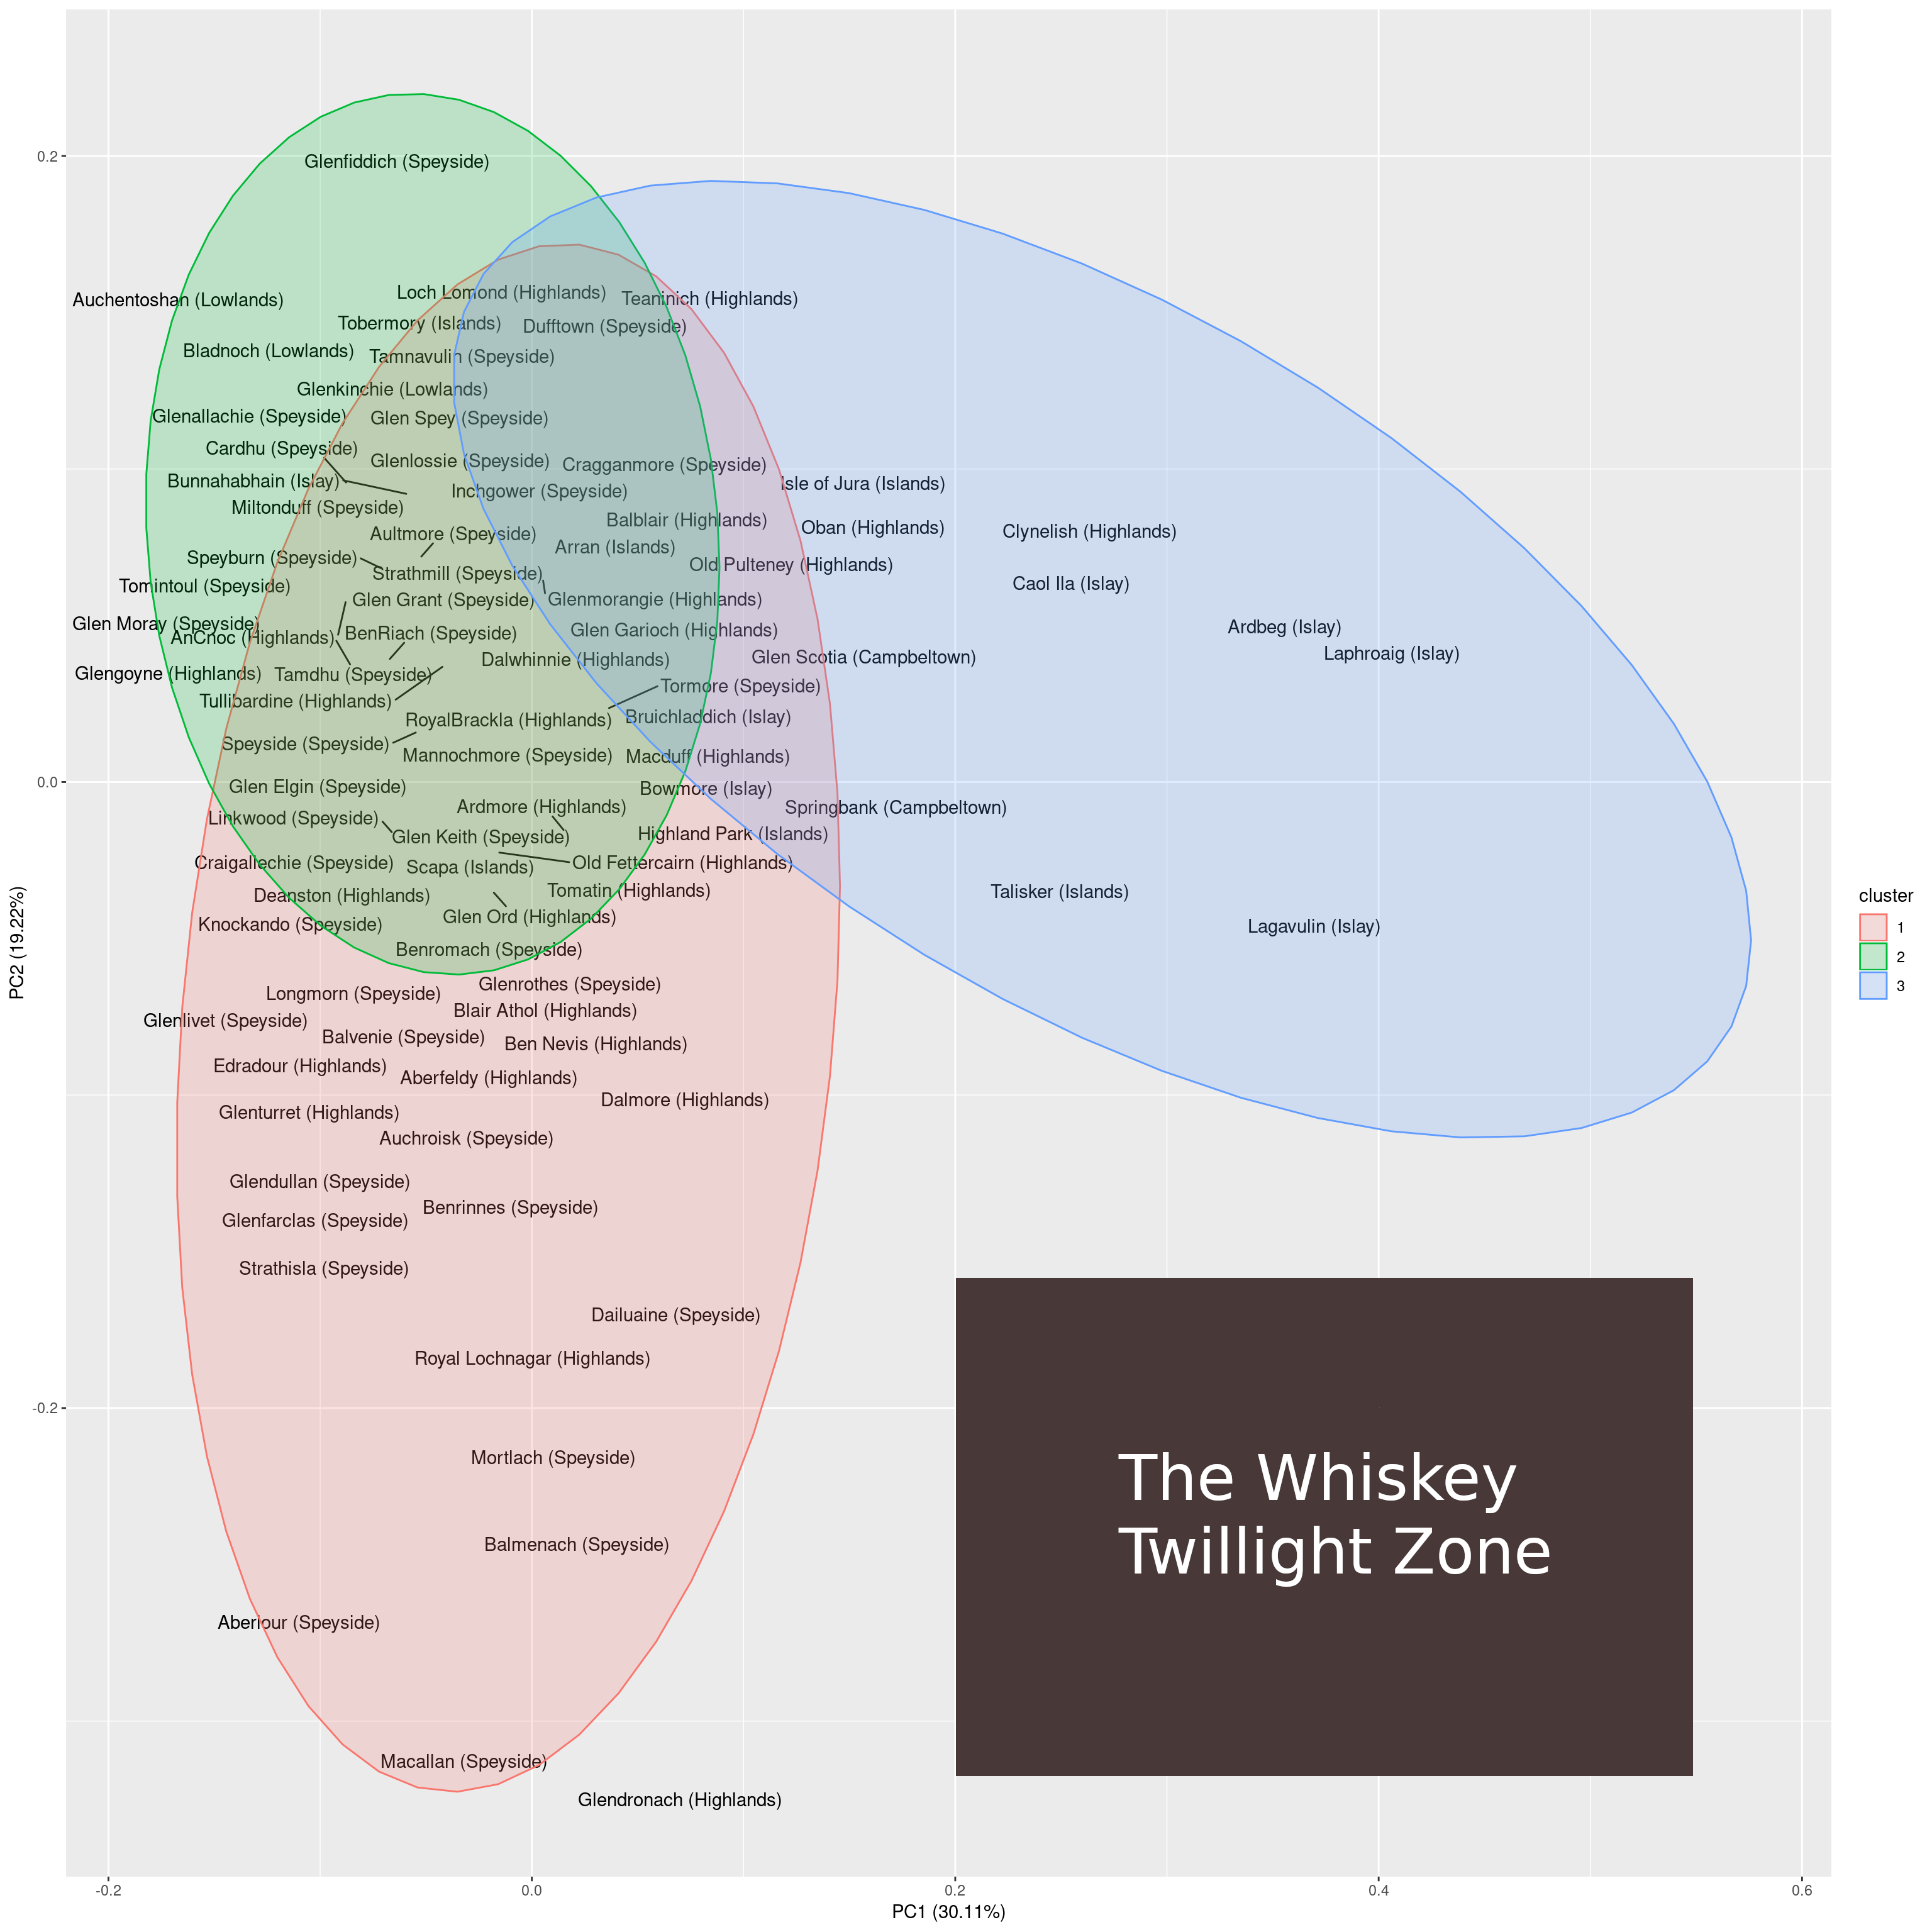
Dimensionality reduction has two primary use cases: data exploration and machine learning. It is useful for data exploration because dimensionality reduction to few dimensions (e.g. 2 or 3 dimensions) allows for visualizing the samples. Such a visualization can then be used to obtain insights from the data (e.g. detect clusters and identify outliers). For machine learning, dimensionality reduction is useful because oftentimes models generalize better when fewer features are used during the fitting process.
Interpreting generalized linear models (GLM) obtained through glm is similar to interpreting conventional linear models. Here, we will discuss the differences that need to be considered.
Basics of GLMs GLMs enable the use of linear models in cases where the response variable has an error distribution that is non-normal. Each distribution is associated with a specific canonical link function. A link function \(g(x)\) fulfills \(X \beta = g(\mu)\). For example, for a Poisson distribution, the canonical link function is \(g(\mu) = \text{ln}(\mu)\).
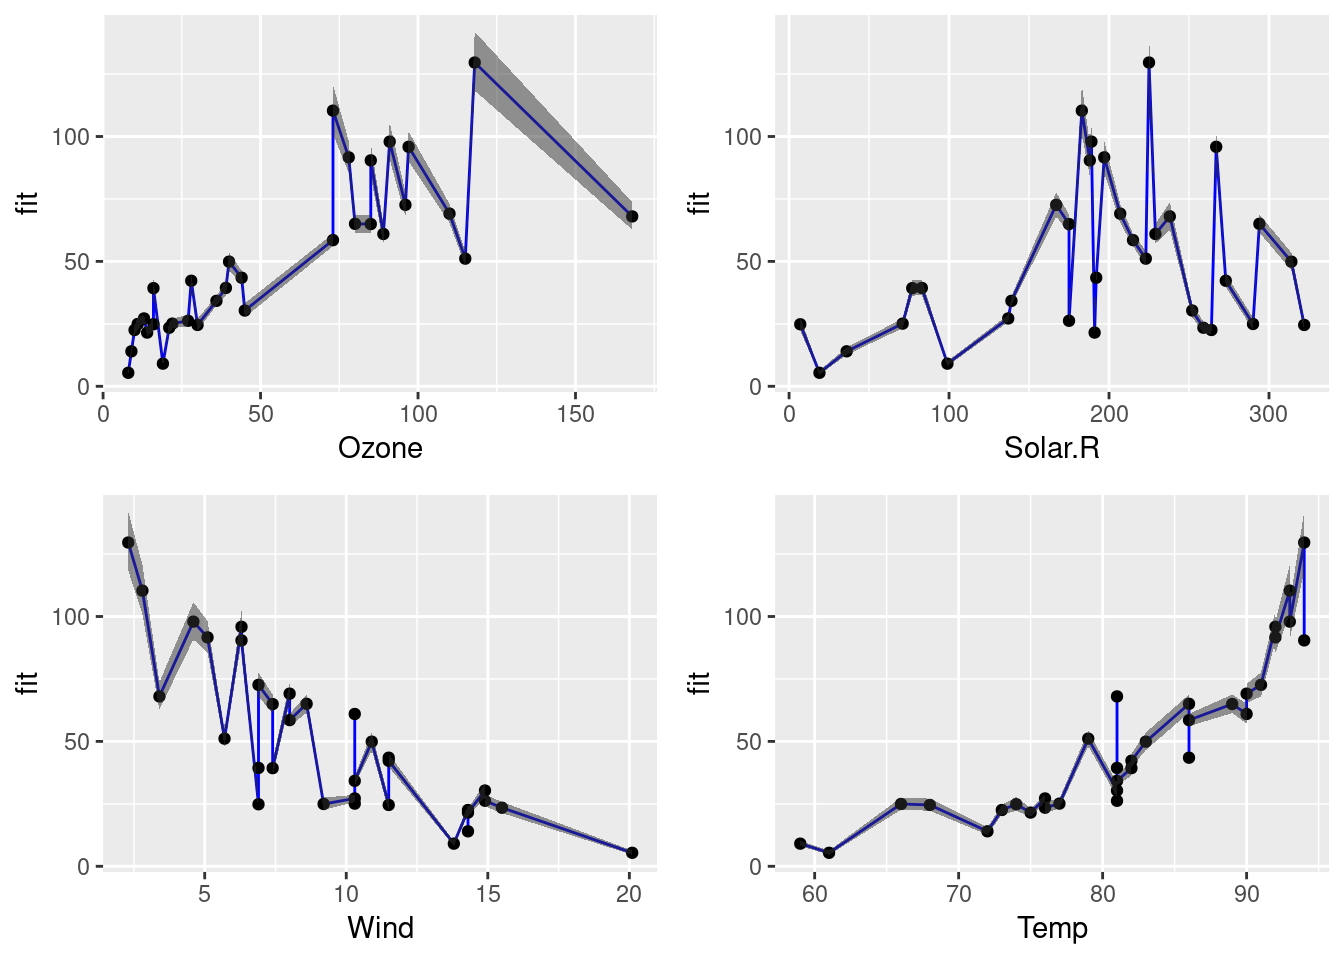
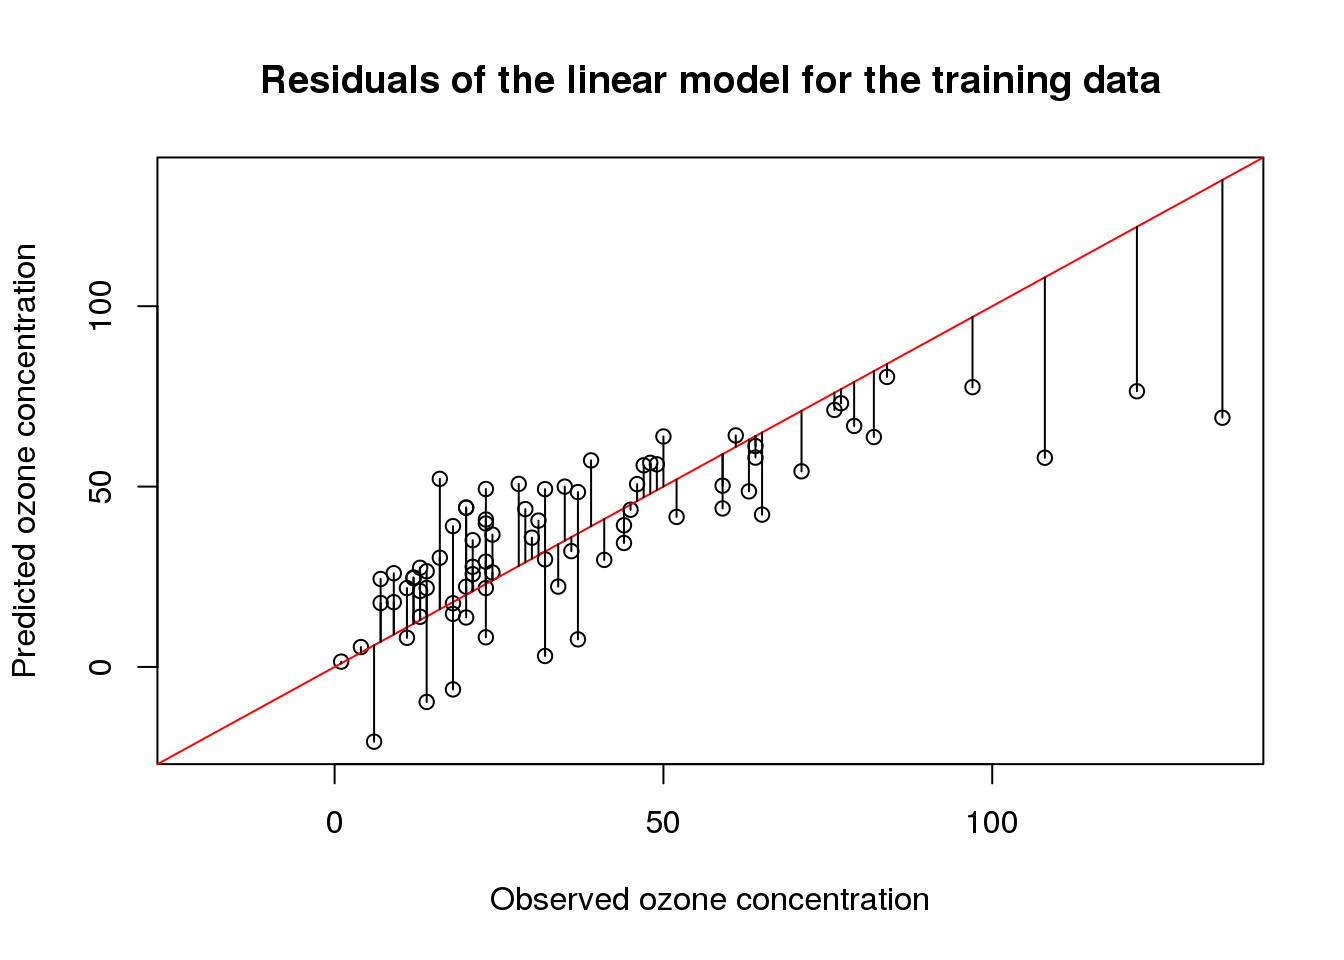
In a previous post, I have introduced the airquality data set in order to demonstrate how linear models are interpreted. In this post, I will start with a basic linear model and, from there, try to find a linear model with a better fit.
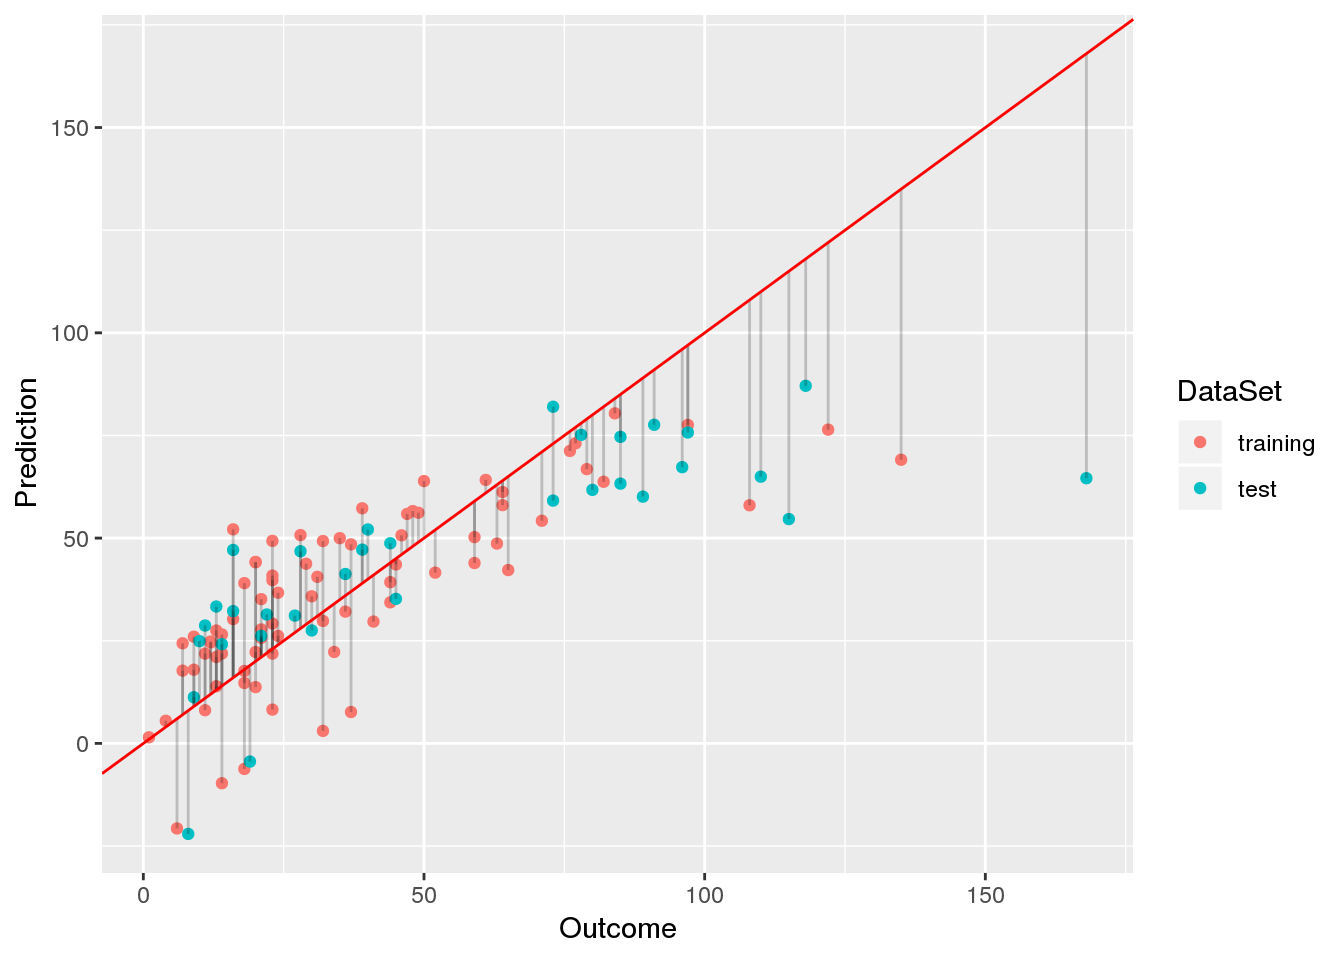
Data preprocessing Since the airquality data set contains some missing values, we will remove those before we begin to fit models and select 70% of the samples for training and use the remainder for testing:
Although linear models are one of the simplest machine learning techniques, they are still a powerful tool for predictions. This is particularly due to the fact that linear models are especially easy to interpret. Here, I discuss the most important aspects when interpreting linear models by example of ordinary least-squares regression using the airquality data set.
The airquality data set The airquality data set contains 154 measurements of the following four air quality metrics as obtained in New York:
Nowadays, infographics are everywhere. Fortunately, you do not have to be a professional designer to create them because there are several free platforms that assist you in creating engaging infographics. In this post, I compare three freely available tools for creating static infographics: Venngage, easelly, and Infogram. Each of the tools is reviewed according to three criteria:
Customizability: number of available templates, graphics, fonts and so on. User experience: how easy is it to design/deploy infographics?