Getting Your Point Across with Infographics
Nowadays, infographics are everywhere. Fortunately, you do not have to be a professional designer to create them because there are several free platforms that assist you in creating engaging infographics. In this post, I compare three freely available tools for creating static infographics: Venngage, easelly, and Infogram. Each of the tools is reviewed according to three criteria:
- Customizability: number of available templates, graphics, fonts and so on.
- User experience: how easy is it to design/deploy infographics?
- Infographic: what is the quality of generated infographics?
For each criterion, I will assign a score from 1 to 5, and, in the end, form an overall score. To evaluate each criterion, I decided to create the same type of infographic, a brief history of machine learning, using all three platforms.
Venngage
The Venngage main page
Venngage is a free online platform for creating infographics as well as other types of content (e.g. presentations and reports). I definitely like the creative name of the platform as it seems to be a portmanteau of Venn (from Venn’s diagram) and engage. The free version has the following main limitations:
- Not all templates and graphics are available
- One can store at most 5 projects
- Infographics cannot be exported as figures
Customizability: 4/5
There is a large repository of templates, which should provide a good starting point for most types of infographics. Once you have selected a template, you can customize it in several ways, for example, by adjusting the background or adding custom content such as texts, icons, charts, and so on.
In general, I did not find anything that was missing in terms of Venngage’s ability to customize infographics. When searching for icons, however, I found that it was hard to find appropriate ones using the free version.
User experience: 4/5
Working with Venngage, I had a pleasant user experience. The available templates were well-curated. Hence, it was easy to find an appropriate layout for the task at hand. The editor of Venngage is also satisfactory. Every change to a document is automatically stored. Even if you accidentally introduce an error, you can easily revert to the previous version. The only thing that bothered me about the editor was that selecting content was often interpreted as moving content and that highlighting text in bold would not work consistently.
Publishing an infographic with Venngage is also very easy. You just need to include a short JavaScript fragment on your set. Using the JavaScript code, the published infographic always stays up to date, even if you introduce changes to the graphic at a later point in time.
Infographic: 4/5
So, how did Venngage fare with regard to the end result?
What I like about the result is that the infographic is well-structured and that the pictorial representations are helpful visual aids. Moreover, the available space is fully used so that the content is clearly visible. The end result is not perfect, however, because the visuals are too subdued.
easelly
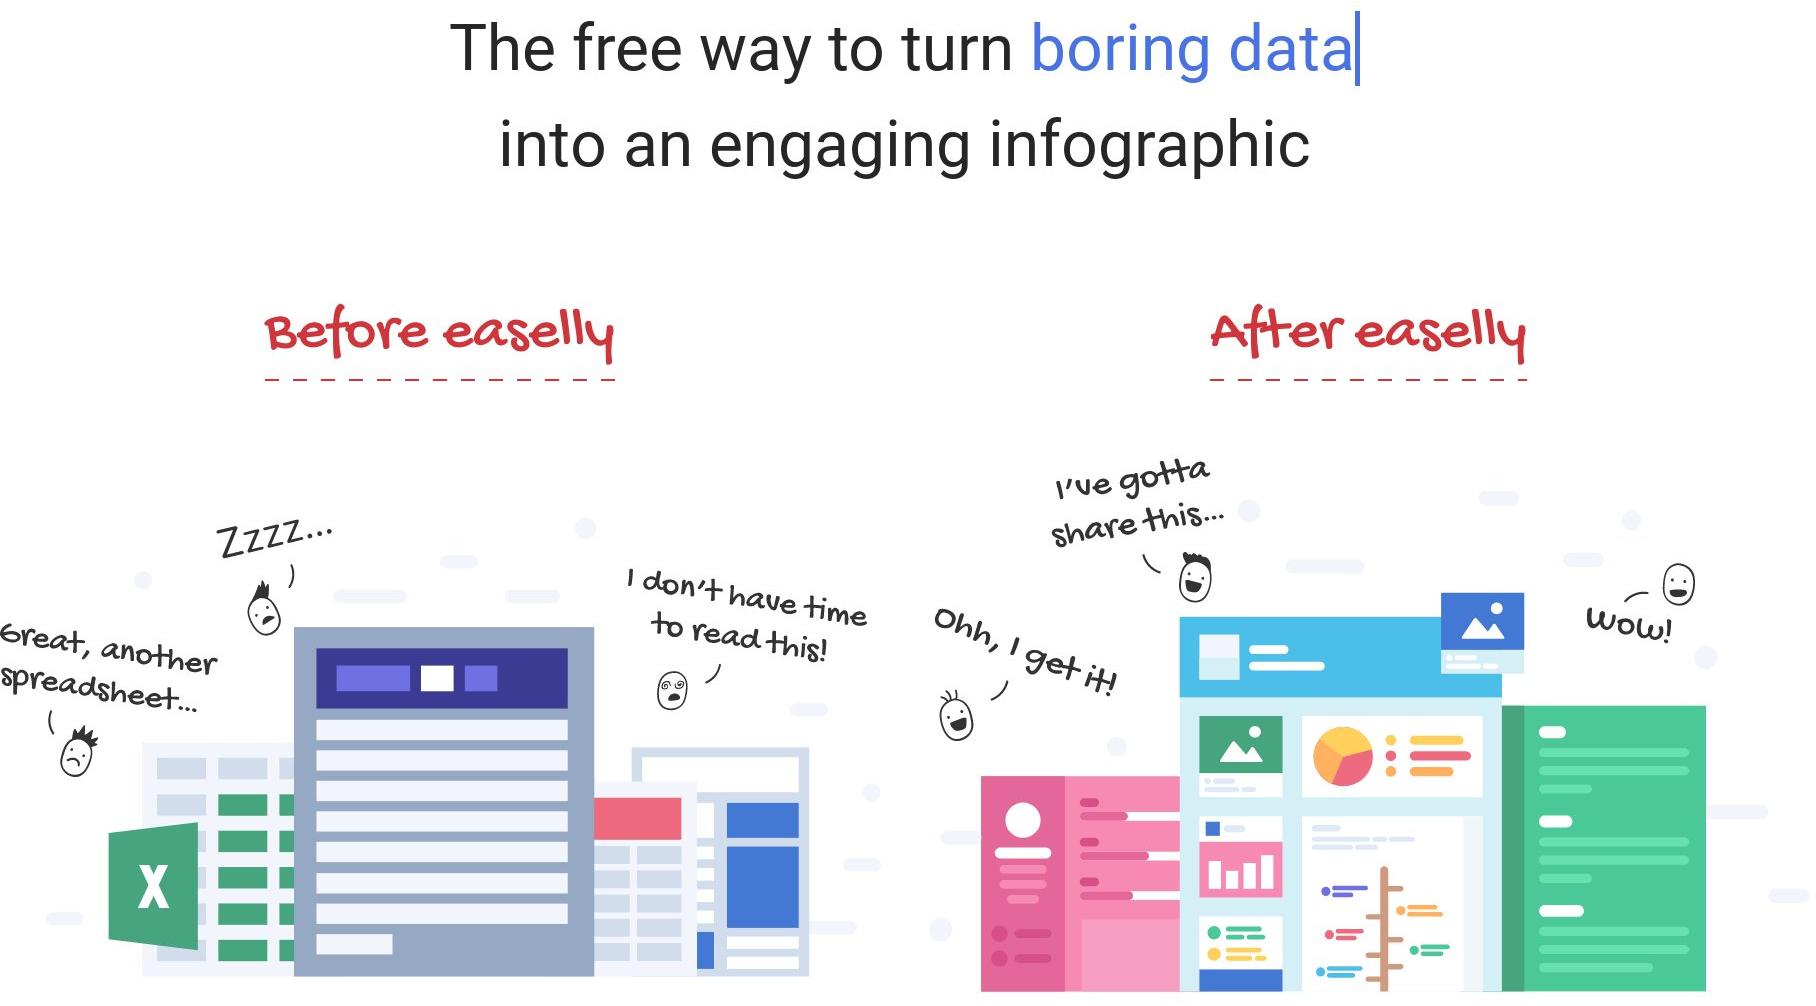
The easelly main page
The only disadvantage of the free version of easelly is that not all templates/graphics are available.
Customizability: 3/5
easelly comes with a large number of templates. In contrast to Venngage, however, where templates are nicely structured according to quality and themes, it is much harder to find an appropriate template using easelly. This is because easelly presents a lot of community-created templates and I could not limit my search. Thus, I had to resort to visually scrolling through hundreds of template variations. In terms of icons/media/fonts for customizing infographics, there is less content available than for Venngage.
User experience: 3/5
The user experience with easelly was mediocre. One aspect that reduced my user experience was that I had to search for an appropriate template for a long time. I also had some issues with the template editor: highlighting individual words in bold font did not work, typing was painfully slow, and it was not always possible to revert to the previous state.
An advantage of easelly over other tools is that it enables users to download infographics as images besides providing the option of embedding the infographic through a code snippet.
Infographic: 2/5
So, how did easelly perform? Have a look yourself:
What I like about this template is its simplicity. The sparse use of colors helps in identifying the individual pieces of information. What I do not like is that, overall, the template is not well structured because there are no additional visual aids. Moreover, the font of the text is hard to read. Since I could easily create the same infographic with image processing software, I have to give eerily a low rating for the end result.
Infogram
The Infogram main page
Infogram is a free tool for creating infographics and other visual content (e.g. reports and dashboard templates). Even in the free version, it comes with a large number of high-quality templates and icons. The main limitations of the free version include:
- Not all templates and graphics are available
- Only 10 projects at a time with at most 3 pages per project are allowed
- Projects cannot be exported as figures
Customizability: 4/5
In the free version there are only few templates available. However, the available templates have a very high quality and their selection is extremely user friendly.
A great feature of Infogram is that you can manually adjust the height of the infographic as a project is not limited to a specific format. For example, a project may even span multiple pages.
User experience: 5/5
The user experience of Infogram was great. This is because template selection worked without hassles and because the editor of Infogram seems to be the best of all platforms. It runs very smoothly and gives a lot of options. Last but not least, Infogram was the only service where I did not experience any problems when creating my infographic.
Infographic: 4/5
The infographic created using Infogram looks as follows:
What I like is the consistent black/green color scheme, which makes the infographic look quite professional. The infographic uses up the available space well. An advantage over the infographic created with Venngage is that the visuals are more dominating. A disadvantage of the dark template is that you have to adjust most custom images to light colors.
Summary
Here is a summary of the results for each tool:
| Tool | Customizability | User Experience | Infographic | Overall |
|---|---|---|---|---|
| Venngage | 4/5 | 4/5 | 4/5 | 4/5 |
| easelly | 3/5 | 3/5 | 2/5 | 2.5/5 |
| Infogram | 4/5 | 5/5 | 4/5 | 4.5/5 |
With an overall rating of 4.5/5, Infogram makes first place, while the second and third places go to Venngage (4/5) and easelly (2.5/5), respectively. Infogram and Venngage worked similarly well although Infogram made a slightly more professional impression on me. Although easelly only made third place, it is noteworthy that this is the only free platform with which you can download your infographics, albeit in low quality.
In terms of restrictions of the free version, Infogram and Venngage are more limited than easelly. For example, only easelly allows free users to have an unlimited number of projects. Thus, the free versions of Venngage and Infogram are appropriate for dabbling in infographics but not if you are going to use them frequently.
Which tool do you prefer for creating infographics? Which of the three infographics do you like best? Write a comment and let me know!


Comments
There aren't any comments yet. Be the first to comment!