Although all posts in this blog are somehow concerned with analyzing data, not all of them lead to new insights. Posts in the analysis series exhibit at least one of the following two properties:
The analysis of the data is comprehensive (i.e. involving multiple approaches) The analysis leads to new insights Posts in the analysis series The following posts are concerned with the analysis of individual data sets.
Unsupervised learning is the aspect of machine learning that is concerned with approaches for learning from data where the outcomes are not available. The main goal of many unsupervised methods is to improve the interpretability of the data.
Clustering The goal of clustering is to assign each observation in a data set to a group based on the observed values associated with each observation. Different clustering approaches rely on different target functions and therefore lead to different cluster assignments.
There is a large number of different types of plots for visualizing data.
Basic plots The following plots are frequently used:
The bar plot shows the extent of values according to the height of bars. If the data are normally distributed, they can be display variation by including error bars. The box plot indicates variation by showing the most frequently observed measurements in terms of the first, second, and third quartile.
The benefit of non-parametric tests over parametric tests is that they not make any assumptions about the data. Thus, they are well-suited in situations where the assumptions of parametric tests are not met, which is typically the case for small sample sizes.
Popular non-parametric test This table gives an overview over popular non-parametric tests:
Test Test for what? Wilcoxon rank sum test Difference in medians Wilcoxon signed-rank test Difference in paired means Fisher’s exact test Independence in contingency tables Kruskal-Wallis test Difference of multiple medians Posts about Non-Parametric Significance Testing
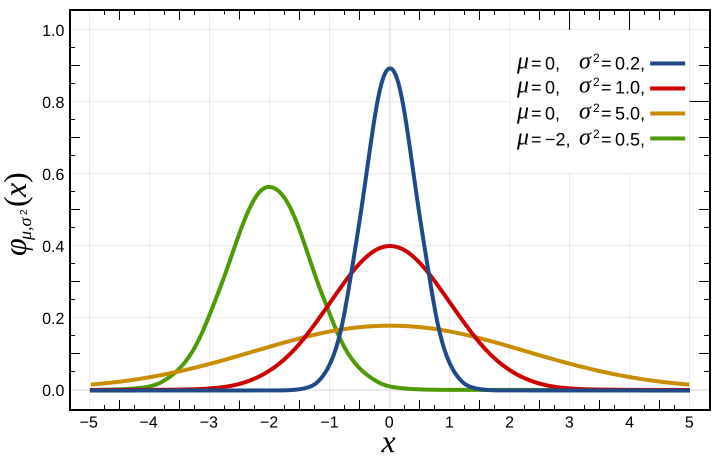
Parametric significance tests assume that the data follow a specific distribution (typically the normal distribution). If their assumptions are met, they have greater power than non-parametric test. Otherwise, non-parametric tests should be used. Thus, parametric tests should only be used after carefully evaluating whether the assumptions of the test are sufficiently fulfilled.
This table gives an overview of the most popular parametric tests:
Test Test for what?
In contrast to independent measurements, matched data consist of measurements that should be considered together. For example, matching can be used in clinical studies. Here, patients that exhibit similar characteristics are paired in order to remove confounding effects. Matched data can also arise naturally when multiple measurements are performed on the same entity. For example, matched data can arise when a clinical marker is measured once before and once after a treatment intervention.